Term
Form conversion
Form conversion is the percentage of users who complete a defined goal in a form, such as successfully submitting an enquiry. It is measured against everyone who reached the chosen starting point.
 Daria Lisovenko16 September 2026≈ 10 min.
What is form conversion?
Form conversion shows what share of users complete a form's goal. That goal might be a successful enquiry, registration, order, test completion, or price calculation. Name the event you count as a conversion. Also name the group you measure it against.
In short: form conversion is the number of successful goal completions divided by the number of users at a defined starting point, expressed as a percentage.
How to calculate form conversion
The basic formula is:
Form conversion rate = successful goal completions ÷ users at the chosen starting point × 100%.
You can start with everyone who visited the page, everyone who saw the form, or only those who began filling it in. Each denominator answers a different question. The resulting rates are not interchangeable.
- Form view to submission measures the share of people who submitted after seeing the form.
- Form start to submission measures the share of people who finished after beginning. This is also called the form completion rate.
- Page visit to submission covers the wider page journey, including visitors who never reached the form.
When comparing periods, devices, traffic sources, or form versions, keep the same numerator, denominator, and rules for repeat submissions.
Conversion at different form stages
Treat a form as a short funnel. Users have to see it, start filling it in, try to submit, and receive confirmation that the submission succeeded. Sometimes their enquiries also pass a qualification step. Each transition has its own conversion rate.
| Transition | Calculation | What it shows |
|---|---|---|
| View → start | Starts ÷ form views | Whether the offer is clear and worth engaging with |
| Start → submission | Successful submissions ÷ starts | How easy the fields and steps are to complete |
| View → submission | Successful submissions ÷ form views | The overall effectiveness of the form |
| Submission → qualified lead | Suitable enquiries ÷ submissions | The quality of the collected enquiries |
The overall rate hides where people leave. You can have a low view-to-submission rate and a high completion rate: people who start finish successfully, but most viewers never begin. The problem is likely before the first field. Check the offer, page context, trust, and whether people can see the form.
The reverse is a high start rate with a low completion rate. Users are interested, then meet a long flow, a confusing question, an unexpected required contact field, an error, or a poor mobile experience. Changing the page headline will not fix that loss. The problem is inside the form.
Calculation example
During one week, 1,000 users visited a page containing a form. Of those users, 800 viewed the form, 400 started filling it in, and 80 received confirmation that their submission had succeeded.
- View-to-submission conversion: 80 ÷ 800 × 100% = 10%.
- Visit-to-submission conversion: 80 ÷ 1,000 × 100% = 8%.
- Form completion rate: 80 ÷ 400 × 100% = 20%.
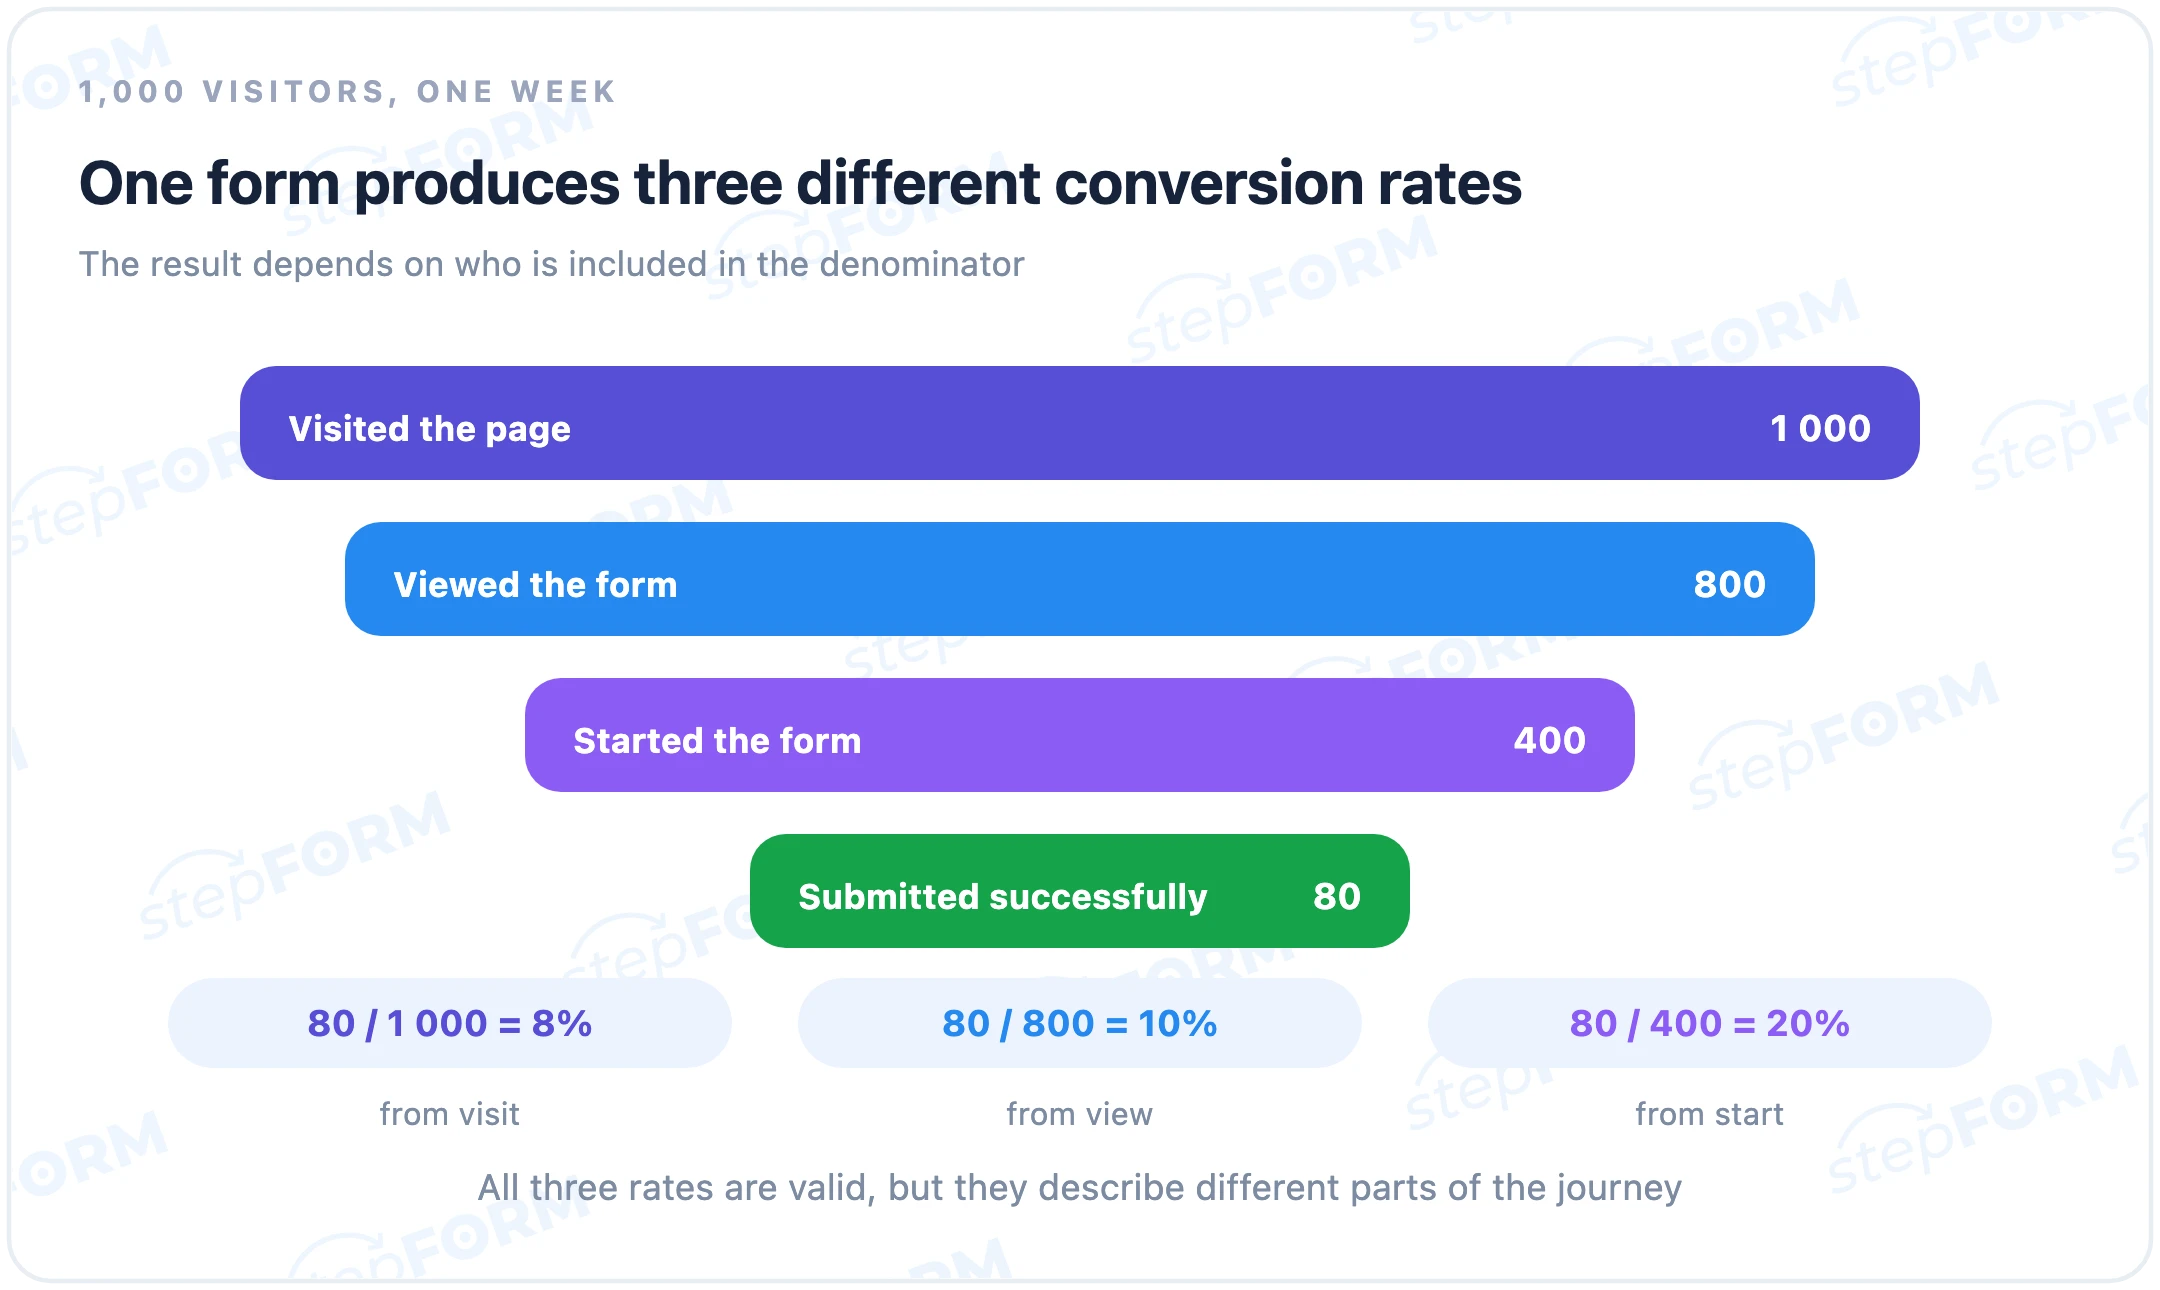
All three results are valid. They describe different parts of the journey. A report saying only “form conversion is 20%” does not give a reader enough to interpret the result.
How to interpret the rate
A high or low rate does not explain why it happened. Audience intent and traffic source, the offer, the device, form placement, the number of steps, or technical errors may affect it. Comparing the form with an earlier version or an alternative running under similar conditions is usually more useful than looking for a universal benchmark.
Read the rate alongside data volume and outcome quality. One submission from two visits gives 50%, but that sample is too small for a stable conclusion. More submissions are not necessarily better if they bring much more spam or irrelevant enquiries. Choose a meaningful period before analysing the result. Remove internal tests and split the data at least by device and major traffic source.
How to find where users drop out
Diagnosis starts by comparing adjacent stages, not by changing the button colour. Each gap points to a different class of causes.
| What the data shows | What to check first |
|---|---|
| People view the form but rarely start | The value proposition, heading, placement, trust, and match with the traffic source |
| People start but do not submit | Field count, required fields, logic, mobile layout, and question clarity |
| People click submit but success is not recorded | Validation, network requests, error handling, the analytics event, and server response |
| There are many submissions but few suitable leads | Qualification rules, spam protection, question wording, and audience source |
Split the overall rate by device, channel, and form version. An average can stay stable while mobile conversion falls and desktop conversion rises. The same happens when paid advertising brings a cold audience while direct visitors already know the product. The blended number describes neither group accurately.
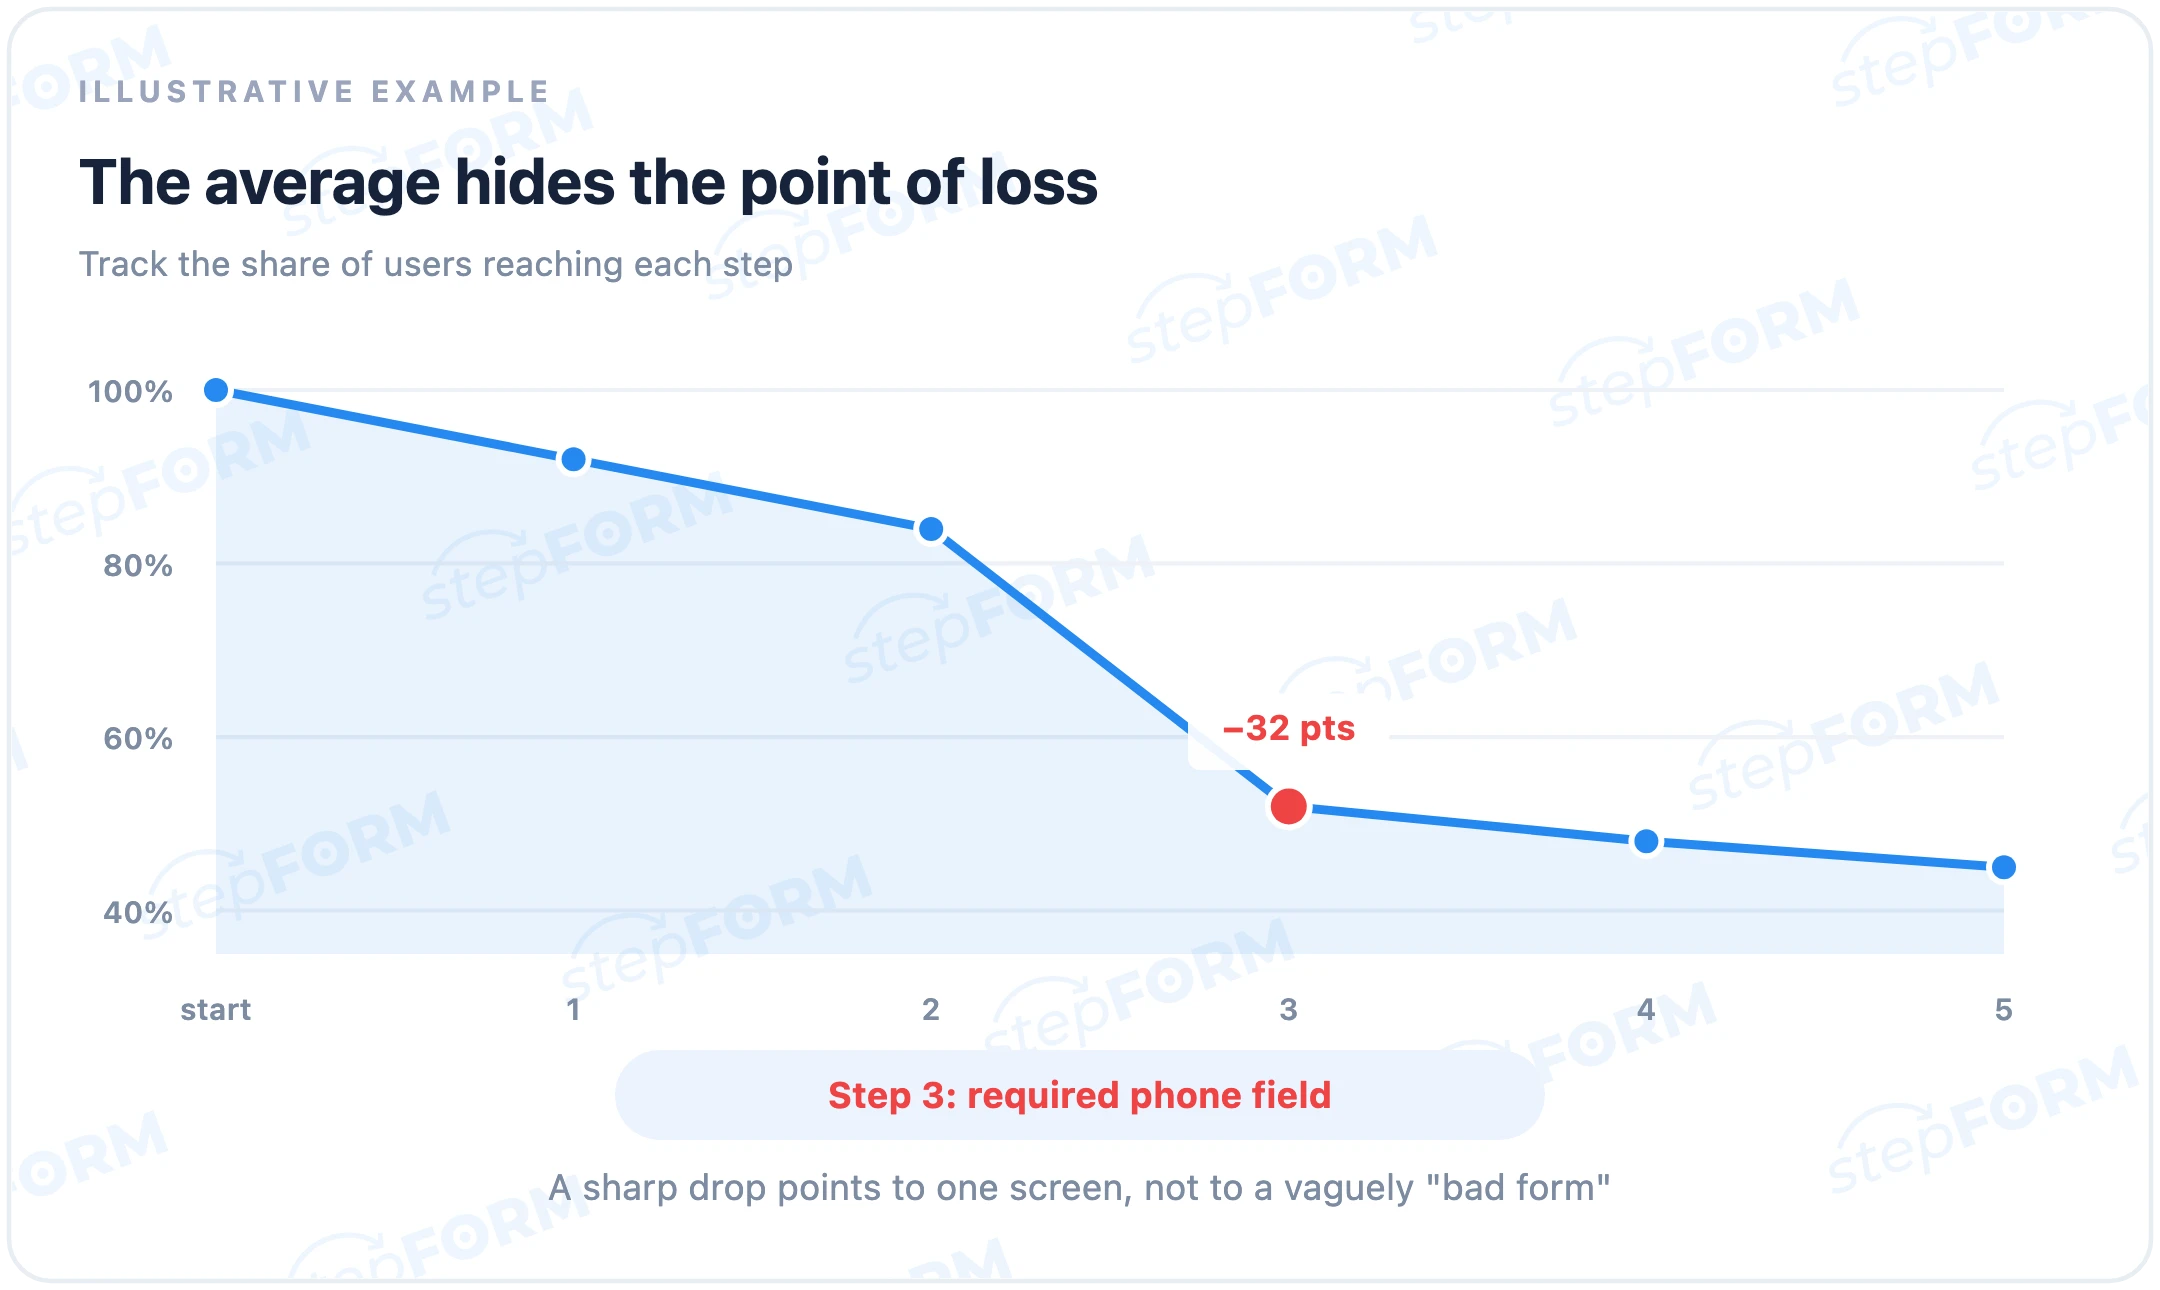
For a multi-step form, also calculate the transition between individual steps. If 90% remain after each of the first two screens but only 55% remain after the third, the problem is localised. If the share declines evenly at every step, the whole flow may be too long or demanding.
What counts as a successful conversion?
A submit-button click is not necessarily a successful conversion. Validation may block it, the network request may fail, or the server may reject the data. Track an event that confirms an accepted result. A success message, thank-you page, or server response showing that the data was saved is more reliable.
A server-confirmed submission, thank-you page, or success message after the data has been accepted.
A button click followed by a validation error, network failure, or rejected request.
A successful submission is not always a new lead either. Duplicates, internal tests, and spam may all be recorded as submissions. Measuring lead generation? Define a valid lead, then measure submission-to-qualified-lead conversion separately.
Common form conversion calculation mistakes
- Counting button clicks instead of successful submissions. The rate then includes attempts stopped by validation or a technical error.
- Changing the denominator between reports. Page-visit conversion cannot be directly compared with completion rate calculated from form starts.
- Mixing users and events. One person may open or submit a form several times. Decide whether the metric counts unique users, sessions, or every submission.
- Combining different forms. A short callback form and a five-step calculator serve different purposes. Their average rate explains very little.
- Keeping internal and invalid responses. Team tests, duplicates, and spam increase the numerator without creating business value.
- Looking only at the percentage. A move from 10% to 15% over twenty visits may be random, while the same change across tens of thousands of visits is an important signal.
How to compare two form versions
Before changing the form, record the metric definition, measurement period, traffic source, and baseline for each stage. Keep those rules after the change. Otherwise you cannot tell whether the new version worked or the audience simply changed.
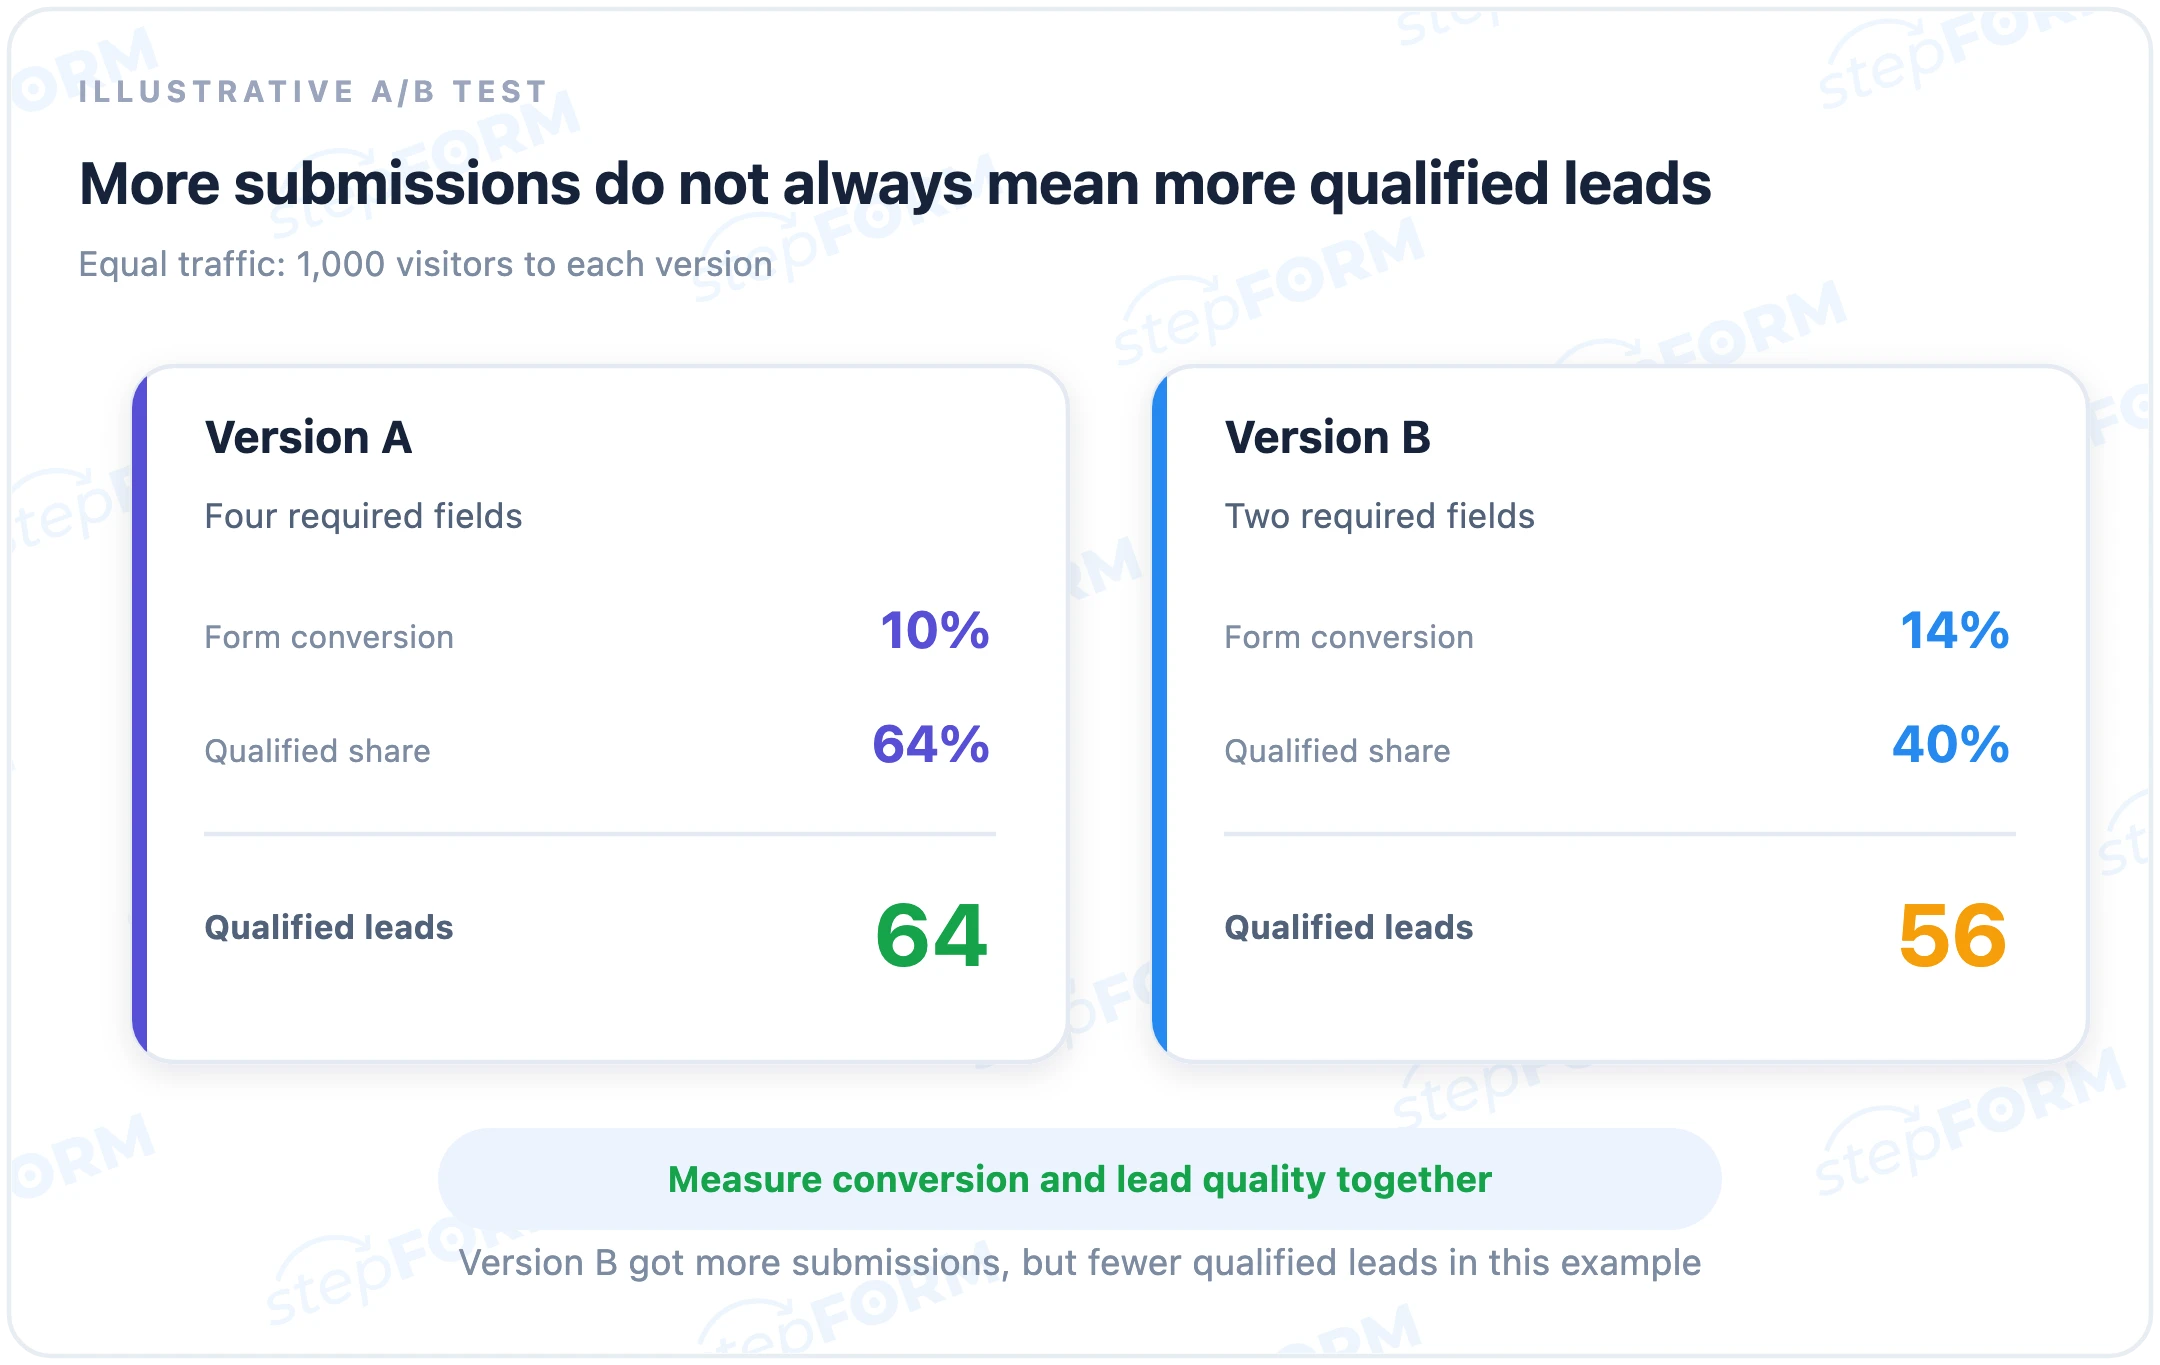
When there is enough traffic, an A/B test is more reliable: comparable groups see the old and new versions at the same time. Change one meaningful element at a time, such as required field count, step order, or offer wording. Replacing the design, copy, and traffic source together may improve the final percentage without revealing why.
Do not measure submissions alone. Removing an important qualifying question may bring more submissions but poorer enquiries. Read form conversion alongside the share of suitable leads and the next business outcome, such as a booking, payment, or sale.
Where form conversion appears in stepFORM
stepFORM can be used to build forms, quizzes, tests, and calculators and publish them through a direct link or embed them on a website. The service supports form statistics and connections to external analytics tools, including Google Analytics and Yandex Metrica.
In Google Analytics 4, the form_start and form_submit events can be used to compare users who begin and submit a form. The automatic collection conditions and event parameters are explained in the official Google Analytics documentation. For a form with custom submission logic, verify that the selected event fires only after the intended action succeeds.
- Define the goal. State exactly which event counts as a successful conversion.
- Verify a real submission. Complete the form manually and make sure the data is accepted.
- Configure the event or goal. Trigger it only after confirmed success.
- Test the analytics. Submit once and confirm that the event appears once.
- Collect a baseline. Measure the unchanged form before comparing a new version.
These checks separate a real behaviour change from a tracking error.
How form conversion differs from related metrics
- Form completion rate uses people who started the form as its denominator. A view- or visit-based conversion rate starts from a broader audience.
- Submission count is an absolute number and does not account for audience size. A rate makes it possible to compare forms or periods with different traffic volumes.
- Lead-to-sale conversion measures a later funnel stage and does not directly describe the form-filling experience.
In brief
- Form conversion is the share of successful goal completions from a defined starting point.
- A percentage cannot be interpreted correctly without its numerator and denominator.
- View → start, start → submission, and submission → qualified lead are different transitions.
- A button click is not necessarily a successful submission, and a submission is not always a lead.
- The overall rate should be segmented by step, device, and traffic source.
- Compare with a previous version or a concurrent A/B test rather than a universal benchmark.
Frequently asked questions
What is the formula for form conversion?
Divide successful goal completions by users at the chosen starting point, then multiply by 100%. State the goal and who you included in the denominator.
Which starting point should be used?
It depends on the question. Use page visitors to assess the page, form viewers to assess the form itself, and form starters to assess the completion experience. The last option is more precisely called form completion rate.
Can a submit-button click be counted as a conversion?
Only if the click itself is the goal. For an enquiry or order, record confirmed success after validation and data storage. Otherwise you will count failed attempts too.
What is a good form conversion rate?
There is no universal standard. The result depends on the audience source, form type, offer value, device, and success definition. A consistently calculated rate over time or between two versions is more useful.
Why did the rate rise without producing more enquiries?
Traffic may have fallen, the denominator may have changed, or some users may have disappeared from measurement. Read the rate alongside the absolute count. 20% of one hundred visits produces fewer submissions than 10% of one thousand.
How can I tell whether the form is the problem?
Compare adjacent stages. If people start but do not reach a successful submission, the cause is likely inside the form. If almost nobody starts, check the offer, page, and traffic source first.